Infographic Design That Turns Data into Shareable Stories
Clear, accurate and visually striking infographics that explain complex topics, support your content and earn links, shares and attention.
Why infographics still work
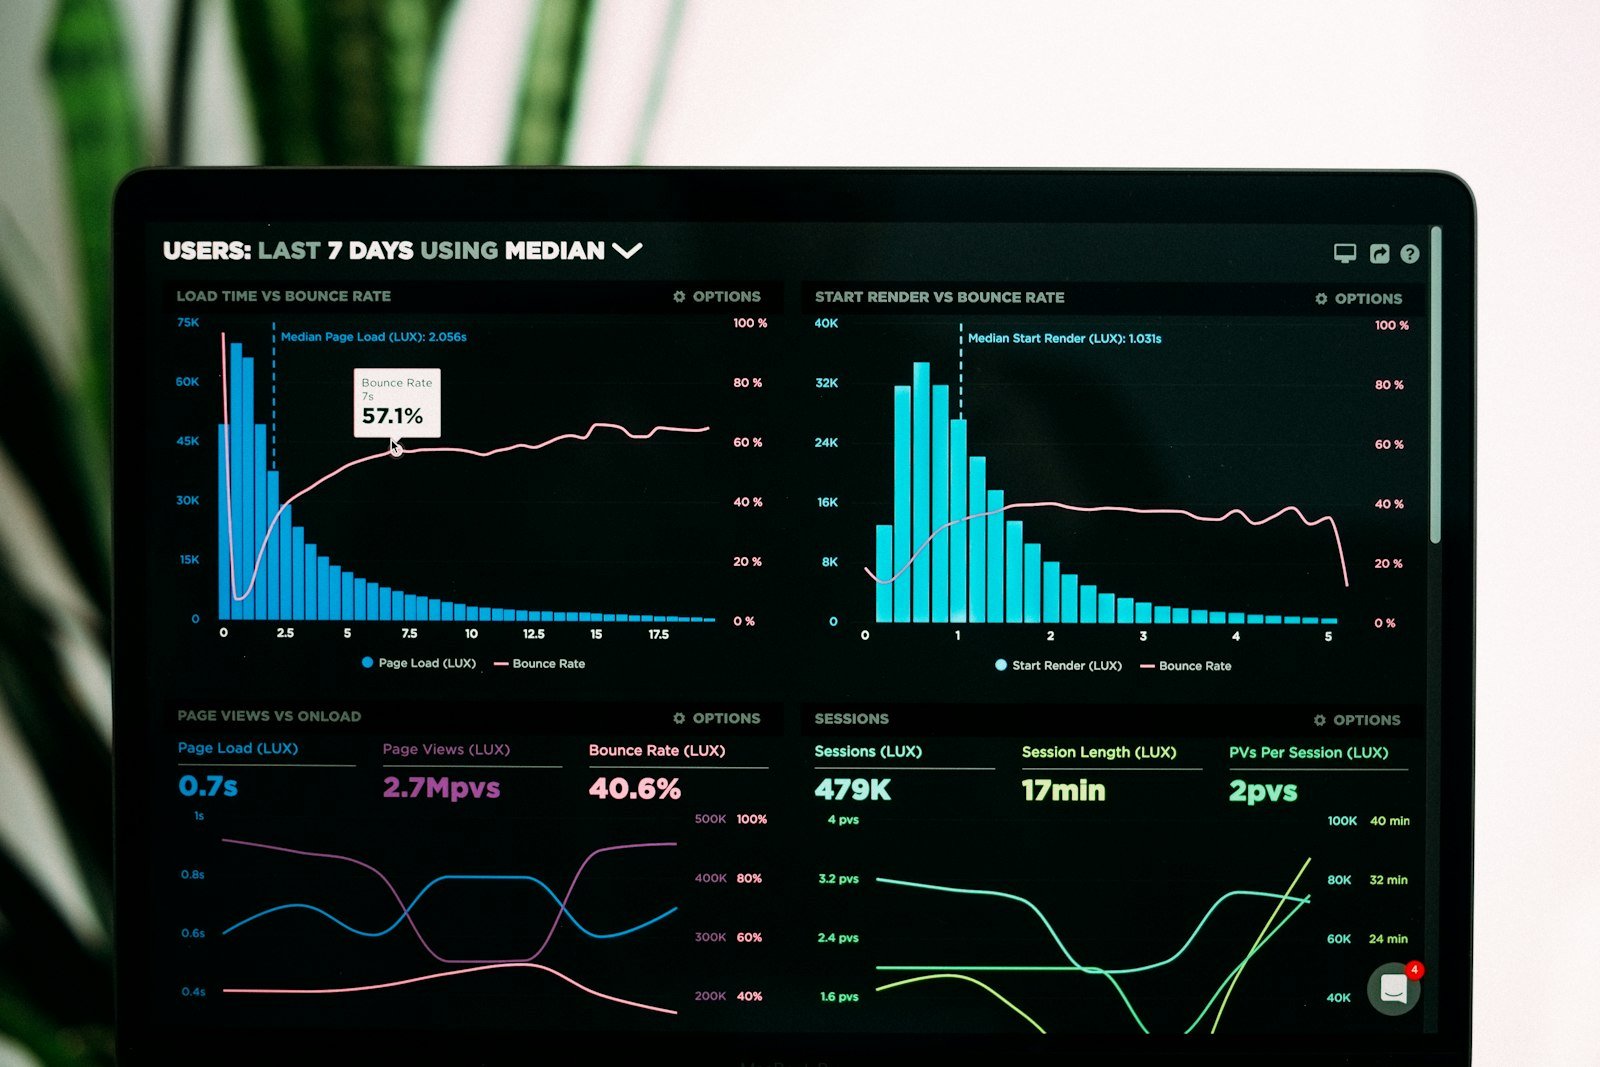
People process visuals faster than paragraphs. A well-made infographic turns statistics, processes, comparisons and timelines into something readers can grasp in seconds, remember and share. For marketers, infographics serve several jobs at once: they enrich blog posts, give journalists and bloggers a reason to link, work on social media and in presentations and can be repurposed into carousels, short videos and slides. Our approach prioritises accuracy and usefulness over decoration.
Types of infographic we create
- Statistical: survey results and data highlights.
- Process and how-to: step-by-step guides.
- Comparison: product, plan or option comparisons.
- Timeline: history and roadmap stories.
- Geographic: maps and regional data.
- Checklist and cheat-sheet: practical downloadable resources.
- Interactive and animated: online data stories and short animations. See motion graphics.
- Internal and report visuals: annual reports, KPI summaries and training materials.
Our process
1. Topic and audience
We choose subjects with genuine search and sharing potential, informed by keyword research and what already gets linked. See content marketing.
2. Research and data
We gather data from credible sources or your own research and cite every statistic. No fabricated numbers. For original surveys, we document the method so journalists can trust the findings.
3. Story and structure
We decide the main message, the order of information and the visual hierarchy that guides the reader from top to bottom.
4. Design
Designers create the layout with your brand colours, fonts and icons, plus charts that represent data honestly, without distorted scales or misleading visuals. See brand guidelines.
5. Review and finalisation
You review drafts, we fix errors and deliver print, web and social-sized versions, plus a text version for accessibility and SEO.
6. Promotion
An infographic only works if people see it. We publish it on a dedicated page with descriptive text and embed code, and promote it through outreach and social. See digital PR and blogger outreach.
SEO and accessibility
We provide descriptive alt text, a summarised text version of the content and optimised file sizes, so the infographic helps rather than harms page performance. Surrounding copy contains the key ideas in text, which is what search engines and AI tools read. See SEO services.
Typical uses
- Linkable assets for outreach campaigns
- Blog illustrations and guides
- LinkedIn and Instagram carousels
- Sales decks and proposals
- Employee onboarding and training
- Annual reports and impact summaries
What you receive
Final files in PNG, JPG and PDF, optional editable source, social-sized variants and suggested copy for sharing.
Expectations
An infographic can earn links and shares, but results depend on topic, promotion and audience. We recommend a promotion plan with every project, and we do not promise a set number of links.
Infographic Design FAQs
Yes, or we can work from your data and outline.
Typically one to two weeks including research and revisions.
It can earn links and engagement when promoted well and supported with good page content.
Always. Accuracy and transparent sourcing are essential.
Yes, as an interactive page or animation, scoped separately.